eq_q <- 4; eq_p <- 6
pmax <- 4
qs_ceil <- 2; qd_ceil <- 6
df_d <- data.frame(q = c(0, 10), p = c(10, 0))
df_s <- data.frame(q = c(0, 8), p = c(2, 10))
ggplot() +
geom_line(data = df_d, aes(x = q, y = p), colour = "#0066CC", linewidth = 1.1) +
geom_line(data = df_s, aes(x = q, y = p), colour = "#CC3300", linewidth = 1.1) +
geom_point(aes(x = eq_q, y = eq_p), size = 3) +
geom_segment(aes(x = 0, xend = eq_q, y = eq_p, yend = eq_p),
linetype = "dashed", colour = "grey50") +
geom_segment(aes(x = eq_q, xend = eq_q, y = 0, yend = eq_p),
linetype = "dashed", colour = "grey50") +
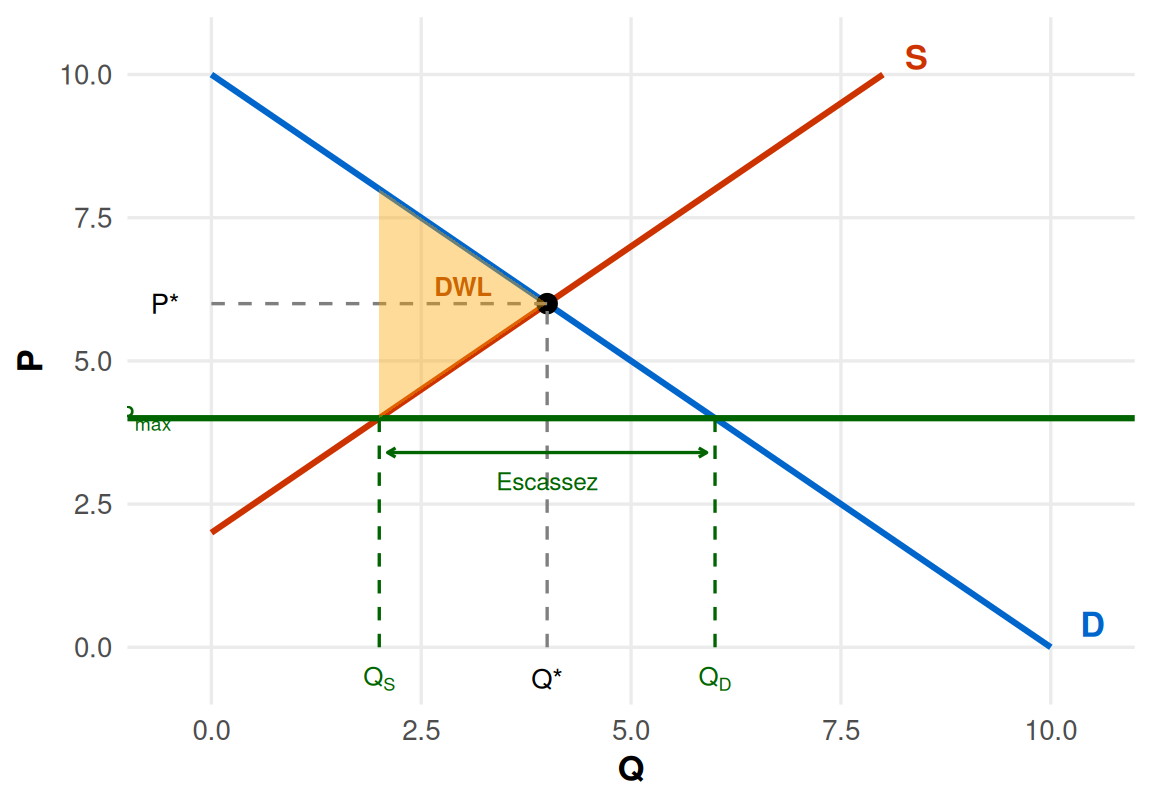
geom_hline(yintercept = pmax, colour = "darkgreen", linewidth = 1.1) +
geom_segment(aes(x = qs_ceil, xend = qs_ceil, y = 0, yend = pmax),
linetype = "dashed", colour = "darkgreen") +
geom_segment(aes(x = qd_ceil, xend = qd_ceil, y = 0, yend = pmax),
linetype = "dashed", colour = "darkgreen") +
geom_polygon(
data = data.frame(q = c(qs_ceil, eq_q, qs_ceil),
p = c(10 - qs_ceil, eq_p, pmax)),
aes(x = q, y = p), fill = "orange", alpha = 0.4) +
annotate("text", x = 10.5, y = 0.4, label = "D",
size = 4.5, colour = "#0066CC", fontface = "bold") +
annotate("text", x = 8.4, y = 10.3, label = "S",
size = 4.5, colour = "#CC3300", fontface = "bold") +
annotate("text", x = -0.55, y = eq_p, label = "P*", size = 3.6) +
annotate("text", x = eq_q, y = -0.55, label = "Q*", size = 3.6) +
annotate("text", x = -0.8, y = pmax,
label = expression(P[max]), size = 3.6, colour = "darkgreen") +
annotate("text", x = qs_ceil, y = -0.55,
label = expression(Q[S]), size = 3.4, colour = "darkgreen") +
annotate("text", x = qd_ceil, y = -0.55,
label = expression(Q[D]), size = 3.4, colour = "darkgreen") +
annotate("text", x = 3.0, y = 6.3, label = "DWL",
size = 3.4, colour = "darkorange3", fontface = "bold") +
annotate("segment",
x = qs_ceil + 0.1, xend = qd_ceil - 0.1,
y = pmax - 0.6, yend = pmax - 0.6,
arrow = arrow(ends = "both", length = unit(0.12, "cm")),
colour = "darkgreen") +
annotate("text", x = (qs_ceil + qd_ceil) / 2, y = pmax - 1.1,
label = "Escassez", size = 3.2, colour = "darkgreen") +
scale_x_continuous(limits = c(-1, 11), expand = c(0, 0)) +
scale_y_continuous(limits = c(-1, 11), expand = c(0, 0)) +
labs(x = "Q", y = "P") +
theme_minimal(base_size = 13) +
theme(panel.grid.minor = element_blank(),
axis.title = element_text(face = "bold"))